👉 Click the link below and request access—I’ll approve it for you shortly!
https://www.notion.so/MSKMRI-KNEE-b6cbb1e1bc4741b681ecf6a40159a531?pvs=4
==============================================
✨ Join the channel to enjoy the benefits! 🚀
https://www.youtube.com/channel/UC4bw7o0l2rhxn1GJZGDmT9w/join
==============================================
👉 "Click the link to purchase on Amazon 🎉📚"
[Visualizing MSK Radiology: A Practical Guide to Radiology Mastery]
https://www.amazon.com/dp/B0DJGMHMFS
==============================================
MSK MRI Jee Eun Lee
📚 Visualizing MSK Radiology: A Practical Guide to Radiology Mastery Now! 🌟 Available on Amazon, eBay, and Rain Collectibles! 💻 Ebook coming soon – stay tuned! ⏳ 🔗 https://www.amazon.com/dp/B0DJGMHMFS 🔗 https://www.ebay.com/itm/3875004193
www.youtube.com
Visualizing MSK Radiology: A Practical Guide to Radiology Mastery
www.amazon.com
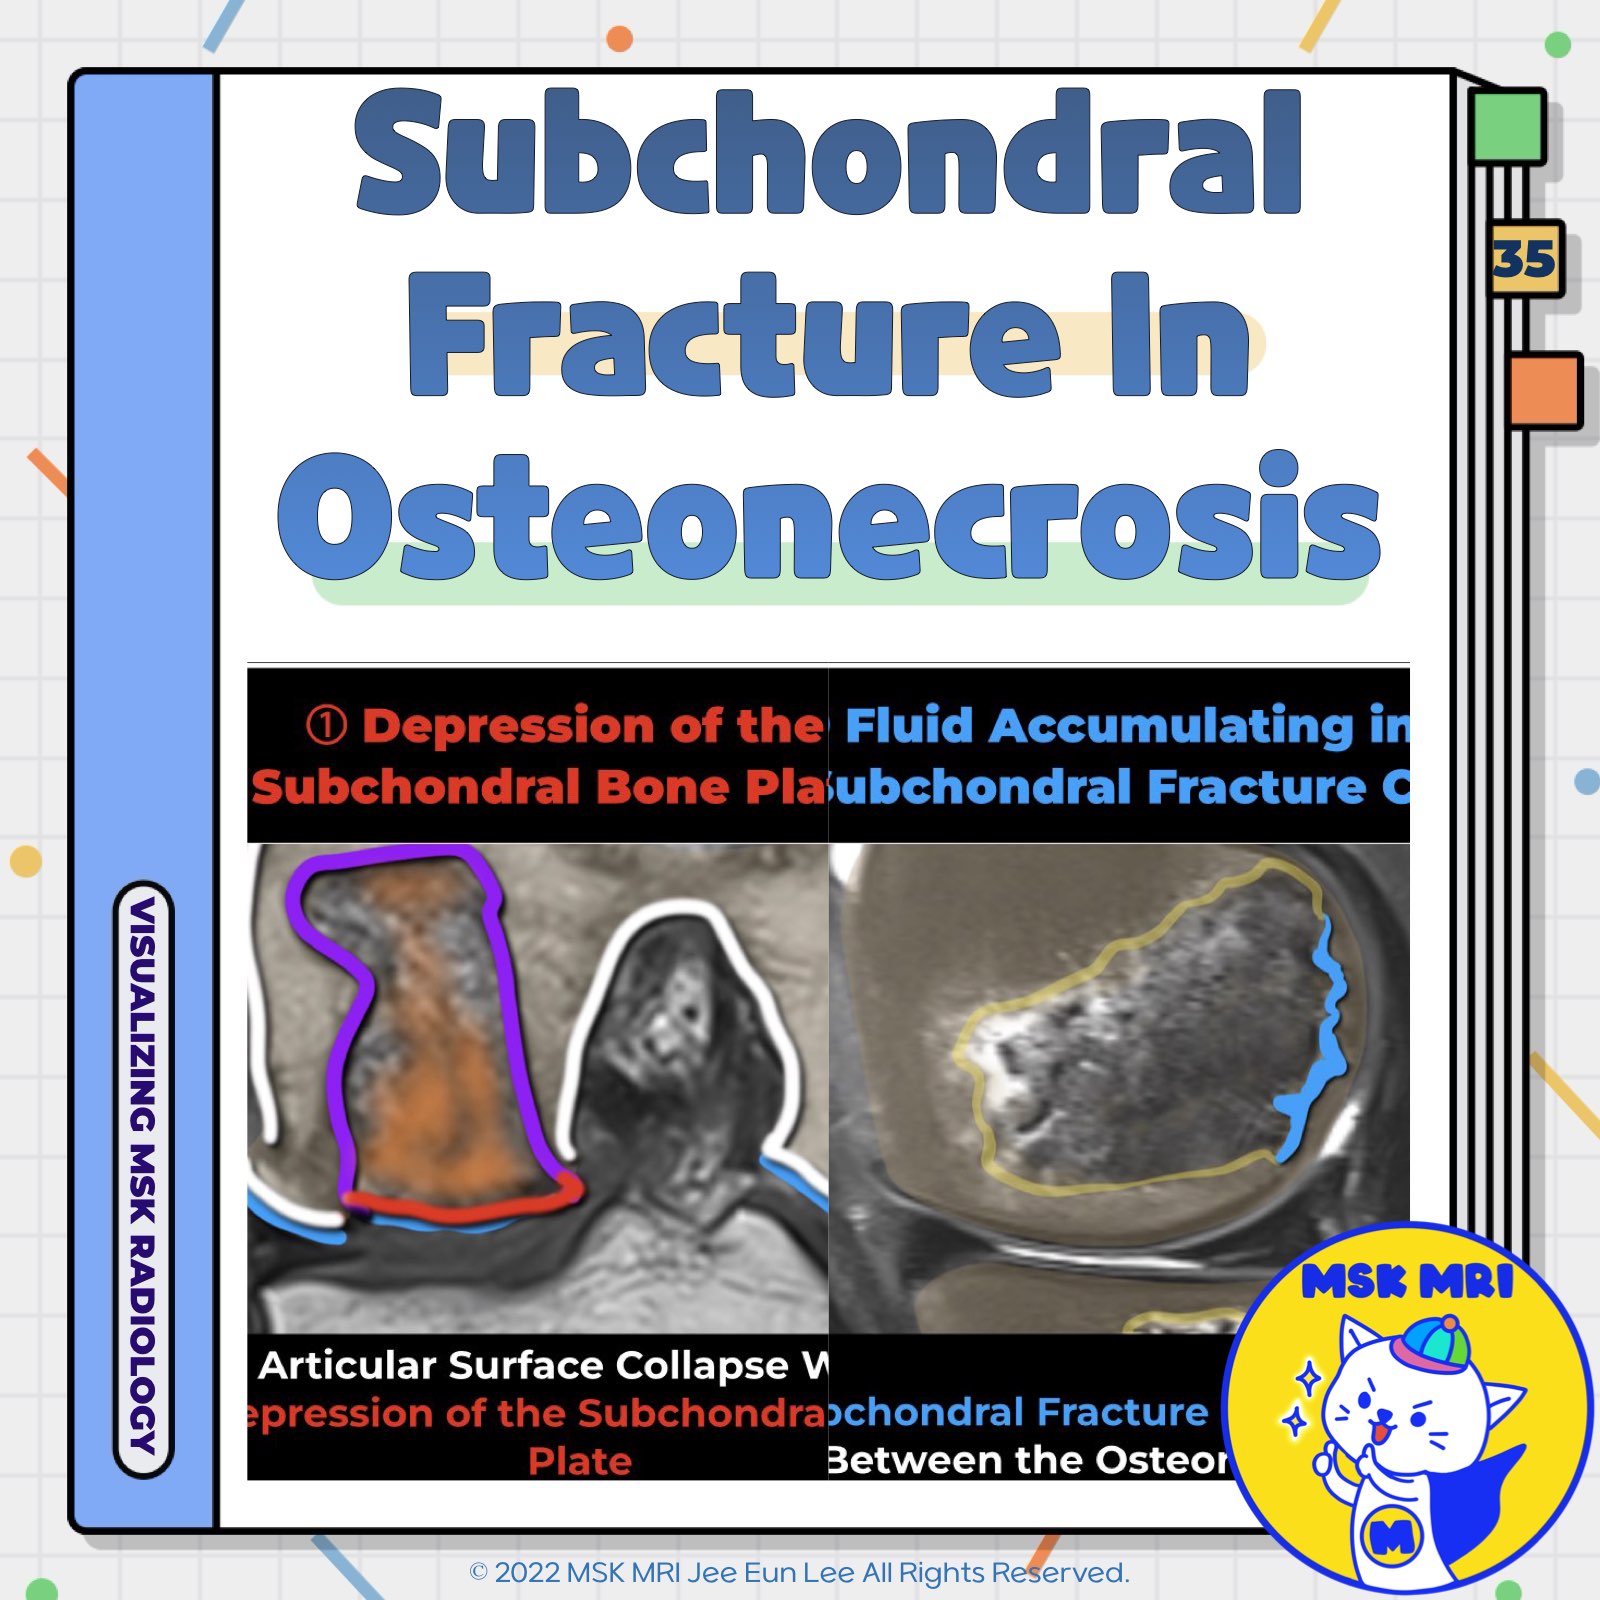
📌 Fracture of the Subchondral Bone Plate in Osteonecrosis
✅ Epiphyseal Collapse
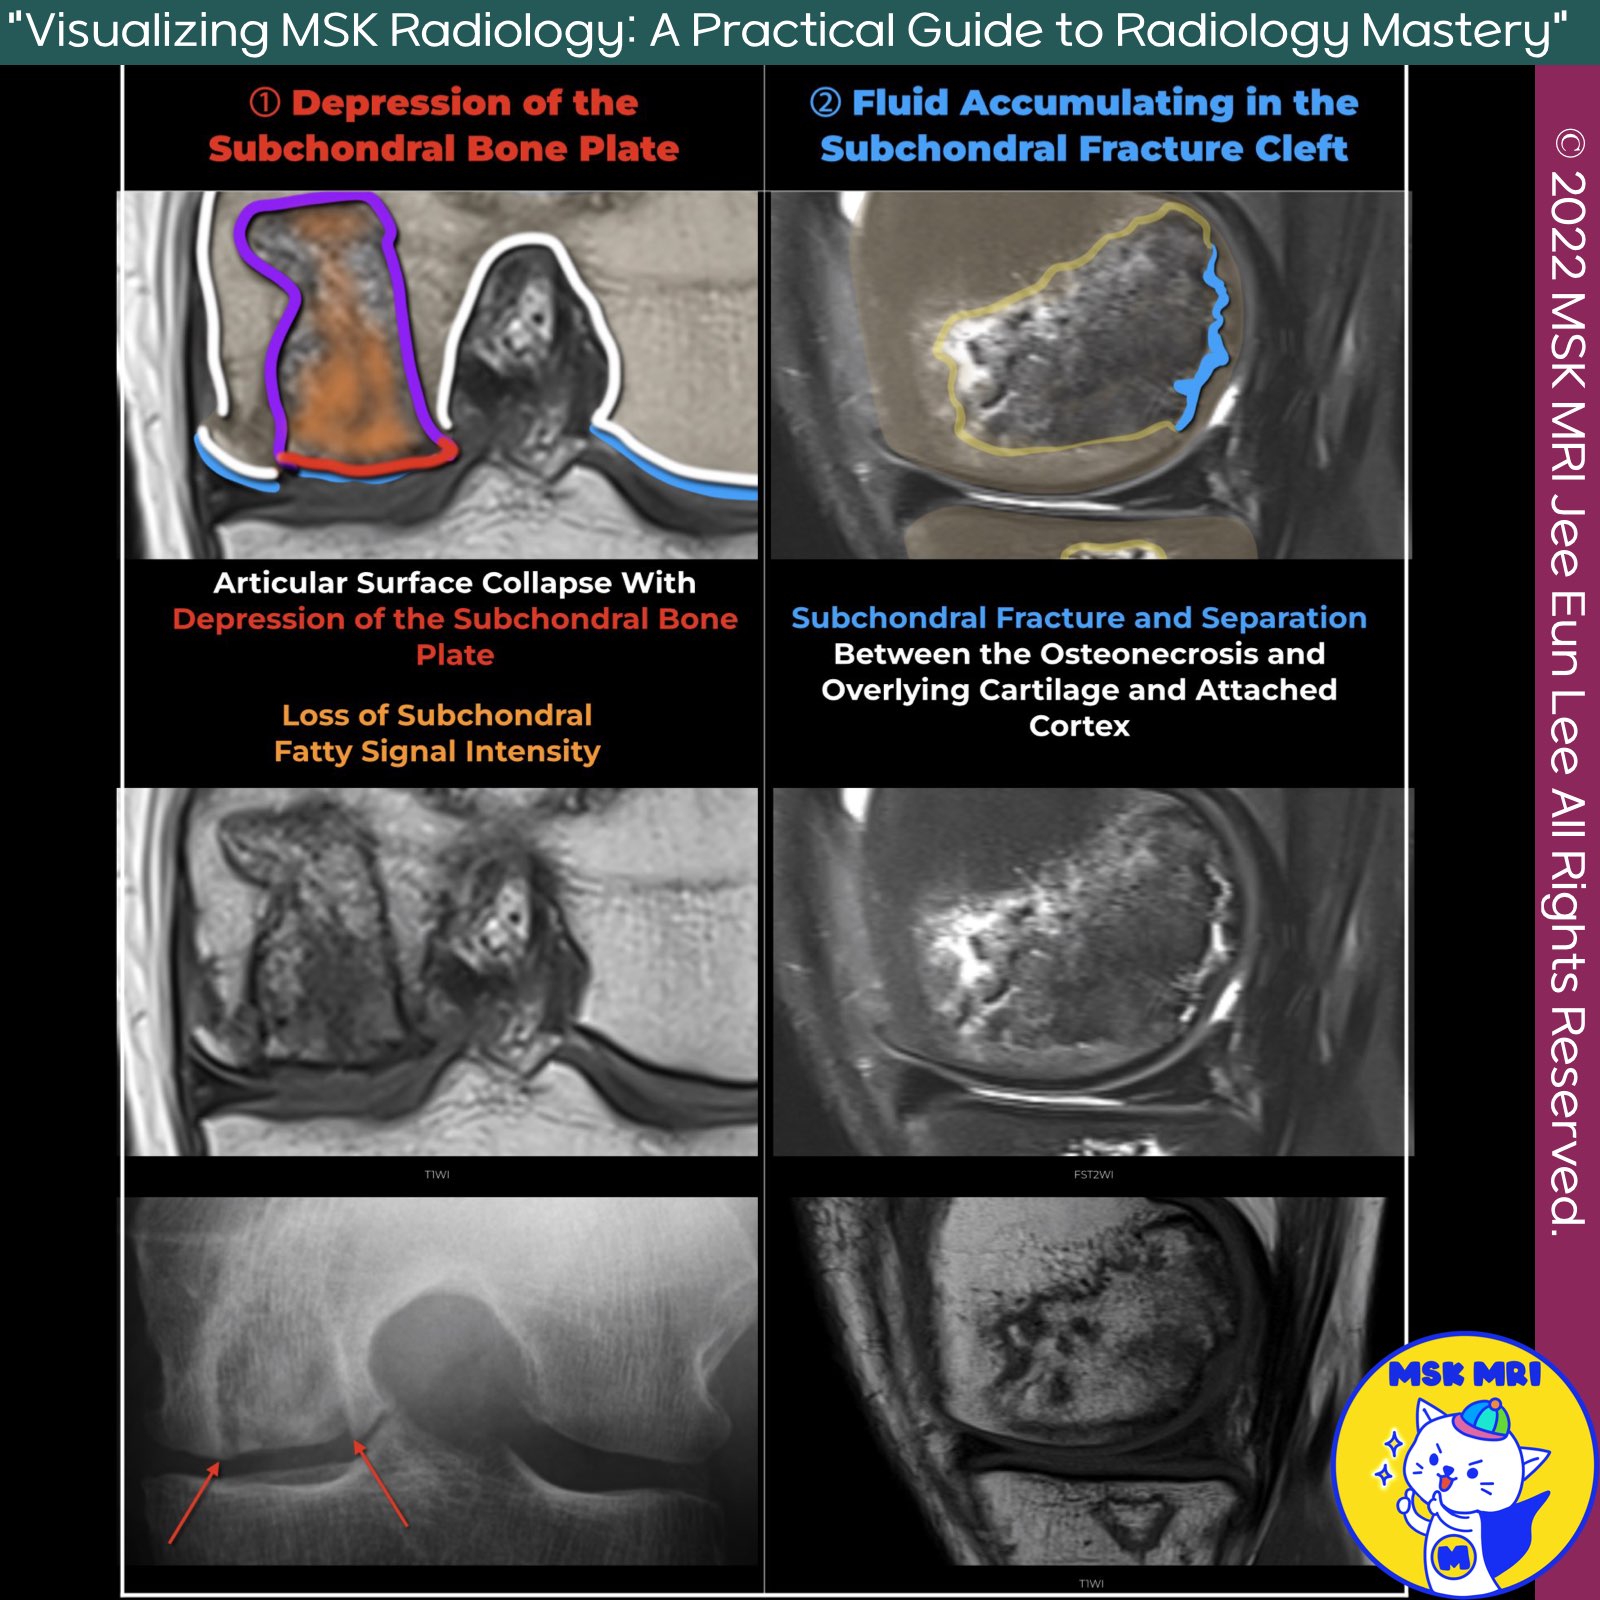
- Epiphyseal collapse in osteonecrosis is characterized by a deformity of the subchondral bone or a fluid-filled cleft, or both.
- This condition is better visualized on radiographs or CT images, likely due to the higher spatial resolution they provide
✅ MRI Patterns of Subchondral Bone Plate Fracture
The fracture of the subchondral bone plate can present two patterns on MRI:
- Depression of the subchondral bone plate: This pattern shows a loss of epiphyseal contour
- High-signal-intensity line on T2-weighted MR images: More rarely seen in the knee, this pattern represents fluid accumulating in the subchondral fracture cleft, extending under the subchondral bone plate
✅ Changes in Signal After Articular Collapse
- Following articular collapse, the signal in the necrotic segment changes due to fragmentation, invasion of fibrovascular tissue, and secondary cyst formation.
- The normal fatty signal intensity on T1-weighted images is lost, replaced with inhomogeneous low to intermediate signal intensity, especially in the weight-bearing area of the infarct
✅ Factors Contributing to Collapse
Several factors contribute to the development of a collapse:
- Fatigue microfractures: The cumulative effect of these fractures in the necrotic zone.
- Osteoclastic activity: This activity causes weakening of the trabeculae in the reparative front.
- Mechanical stress: Focal concentration of mechanical stress on thickened bone trabeculae in the reparative zone along the AVN margins acts as “stress risers”
✅ Risk Factors for Collapse in the Femoral Condyle
- The risk of collapse in the femoral condyle is directly related to the size and location of the infarct.
- Lesions involving more than one-third of the condyle on midcoronal MR images or the middle and posterior one-third of the condyle on midsagittal MR images are at higher risk of collapse.
- Collapse begins at the lateral boundary of the necrotic lesion and, depending on the lesion's size, propagates either along the subchondral region or in the deep necrotic region
References
- AJR 2019; 213:963–982
- RadioGraphics 2018; 38:1478–1495
"Visualizing MSK Radiology: A Practical Guide to Radiology Mastery"
© 2022 MSK MRI Jee Eun Lee All Rights Reserved.
No unauthorized reproduction, redistribution, or use for AI training.
#Osteonecrosis, #SubchondralBone, #EpiphysealCollapse, #MRI, #Radiology, #BoneFracture, #FemoralCondyle, #ArticularCollapse, #MedicalImaging, #Orthopedics
'✅ Knee MRI Mastery > Chap 5AB. Chondral and osteochondral' 카테고리의 다른 글
| (Fig 5-B.36) Subchondral Insufficiency Fracture vs. Osteonecrosis (0) | 2024.07.15 |
|---|---|
| (Fig 5-B.34) Typical Osteonecrosis (0) | 2024.07.14 |
| (Fig 5-B.33) Poor Prognostic Factors in Subchondral Insufficiency Fracture (0) | 2024.07.14 |
| (Fig 5-B.32) Subchondral Fracture with Epiphyseal Collapse: Part 2 (0) | 2024.07.14 |
| (Fig 5-B.31) Subchondral Fracture with Epiphyseal Collapse: Part 1 (0) | 2024.07.14 |


